Unless you have a device on the dash more than once. I think I have some multi sensors on more than once like temp and humidity as separate tiles.
If that device (417) is your smartly injector, yes you only want one of those.
Unless you have a device on the dash more than once. I think I have some multi sensors on more than once like temp and humidity as separate tiles.
If that device (417) is your smartly injector, yes you only want one of those.
I should have used this in my example.
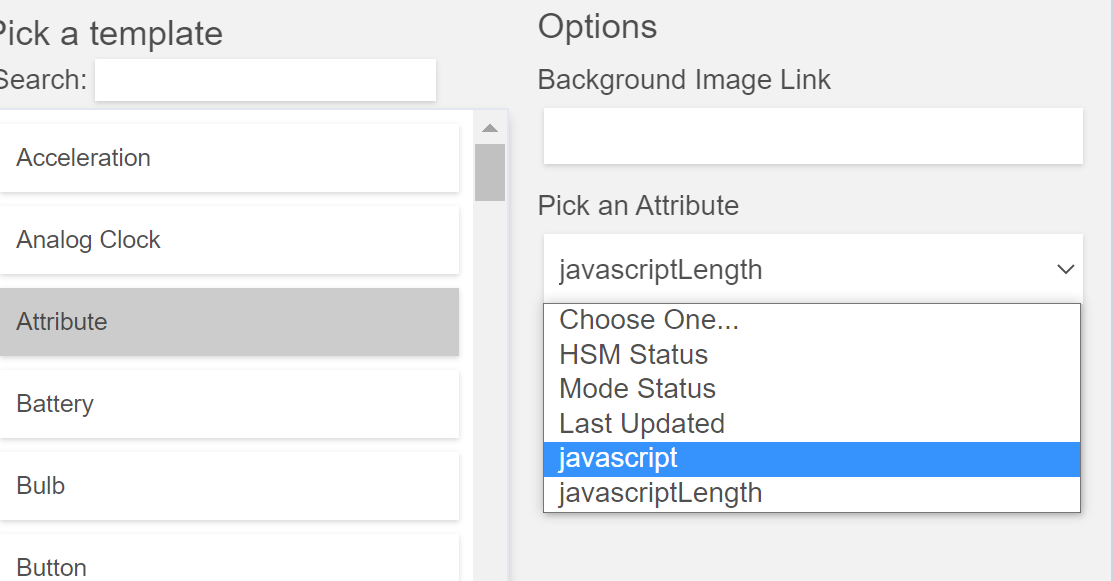
“templateExtra”: “javascript”
And I am assuming since you told me to search for “javascript” then it is the smartly injector tile.
I will remove the (2) extra’s. 
Should there be a error message when someone attempts to insert more than one smartly injector tile?
Technically it’s not an error, just not needed. It won’t create “problems”, but it’s unnecessary. Not sure we need extra dev just to tell people not to. It’s your hub/dashboard put as many as you like
Hi folks;
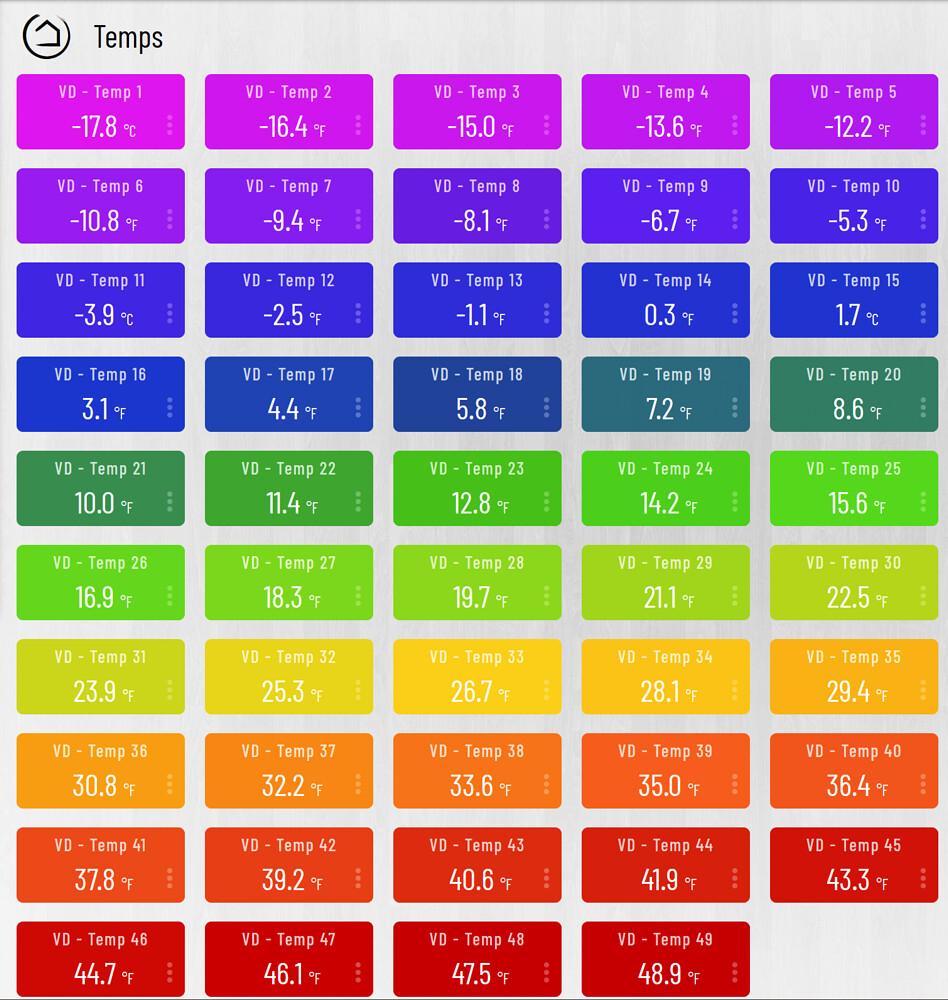
Trying hard here to use the temp/humidity gradient feature but not being able:
Am I doing something wrong?
this is a known issue, but the settings work, the boxes just don’t stay checked.
Do you have the smartly inject device installed on your hub and placed on that dashboard?
I don’t. Is it needed? Also for humidity?
So the settings we mark, even not maintaining marked, is still valid?
What are the ranges used on that one?
Yes, any “dynamic” changes are done by the smartly injector. Once added, you’ll see the tiles are purple when the dash is 1st loaded then the color fills in once smartly inject works it’s magic. Without it they will not function.
Correct
Roughly based off my OG charts.
C
F
EDIT oh wait you mean humidity? Not sure if I have a chart for that, let me check.]
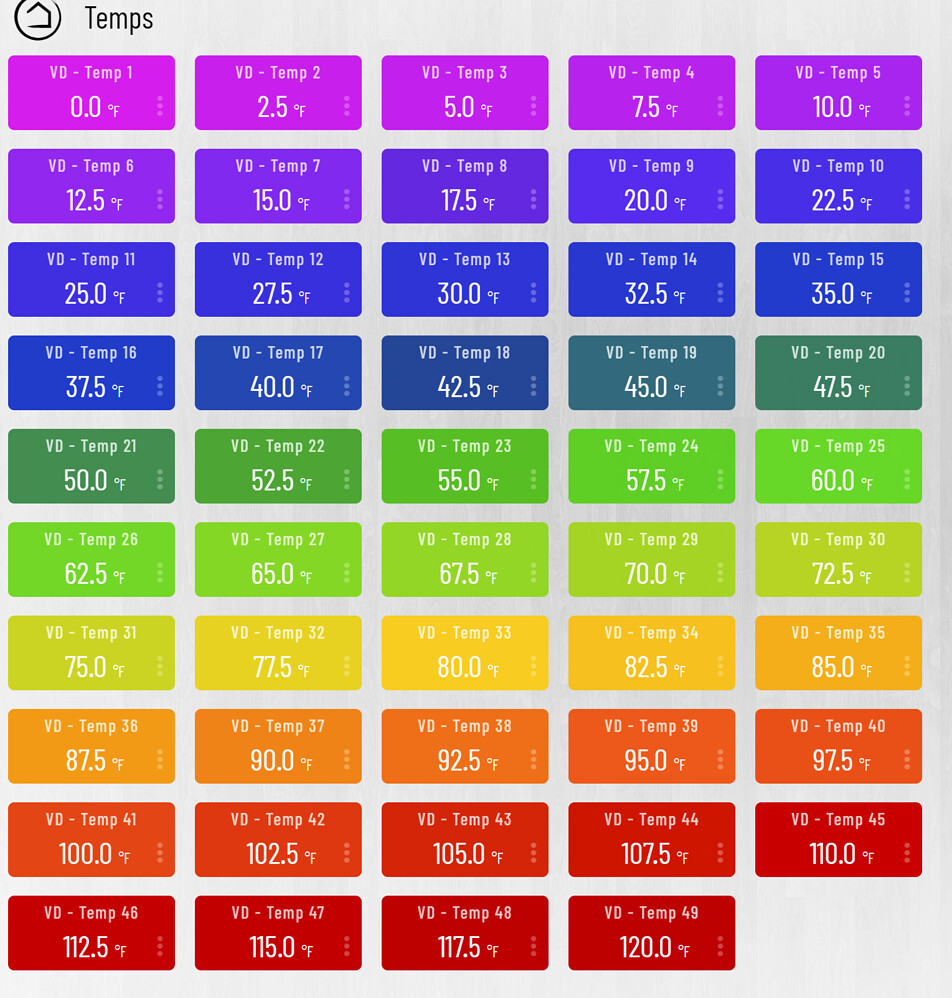
No sorry doesn’t look like I made a humidity color chart. I should. If you want you can add a dozen or so virtual sensors and set them all to 10 percent increments (or less) then put them all on a dash with smartly injector and post the results.
Indeed. As you said, like magic.
Thanks for the support.
So, I have had the tile for smartly on a few dashboards on everything working correct. I went through just now and created new dashboards manually for the rooms in my house and added the tile for smartly, also manually. None of these new dashboards are showing the paw print. The previous instances of smartly are functioning as expected. Nothing happening in the logs besides this,
“Now: 1621840085425, JS length: 1015, Maximum is 1024,”
Be sure you haven’t mistakenly chosen the ‘javascriptLength’ option.
If the tile remains on the screen with 1015 showing, the wrong option is set. Change it to ‘javascript’ If that’s not it LMK and we’ll dig deeper (I did just create a fresh dash to test. It seems to be working as expected)
and Welcome to OLL!
ok…
Is it possible that Smartly and ‘other dashboard editor’ ‘screw’ each other up? (sorry for the word ‘screw’, I can’t seem to find a better word (my english is not thet good)).
Guess there is no way to have both?
On second thought…
I could just throw those away but what with there bodies…? 
Welcome to OLL!
Personally I believe like the late George Carlin ~ “There are no bods words”, but maybe a few that shouldn’t be said on TV. Good thing we’re not on TV
Yes, very possible.
I’m not familiar with “DashEd”. Free to post or PM me a link, but it is likely having one dashboard ‘processed’ by 2 editors will result in undesired, unsupported, resulted. With too many cooks, who knows what might come out of the kitchen!
You can use them both separately on a given dashboard without interference, I presume, but without knowledge of “DashEd” and how it works, I could be mistaken.

First I think i’m gonna dig 50cm deeper so ppls won’t find them if they dig like they normally do.
Second, by putting a ‘Endangered Plant’ on top nobody will even be allowed to dig near it…

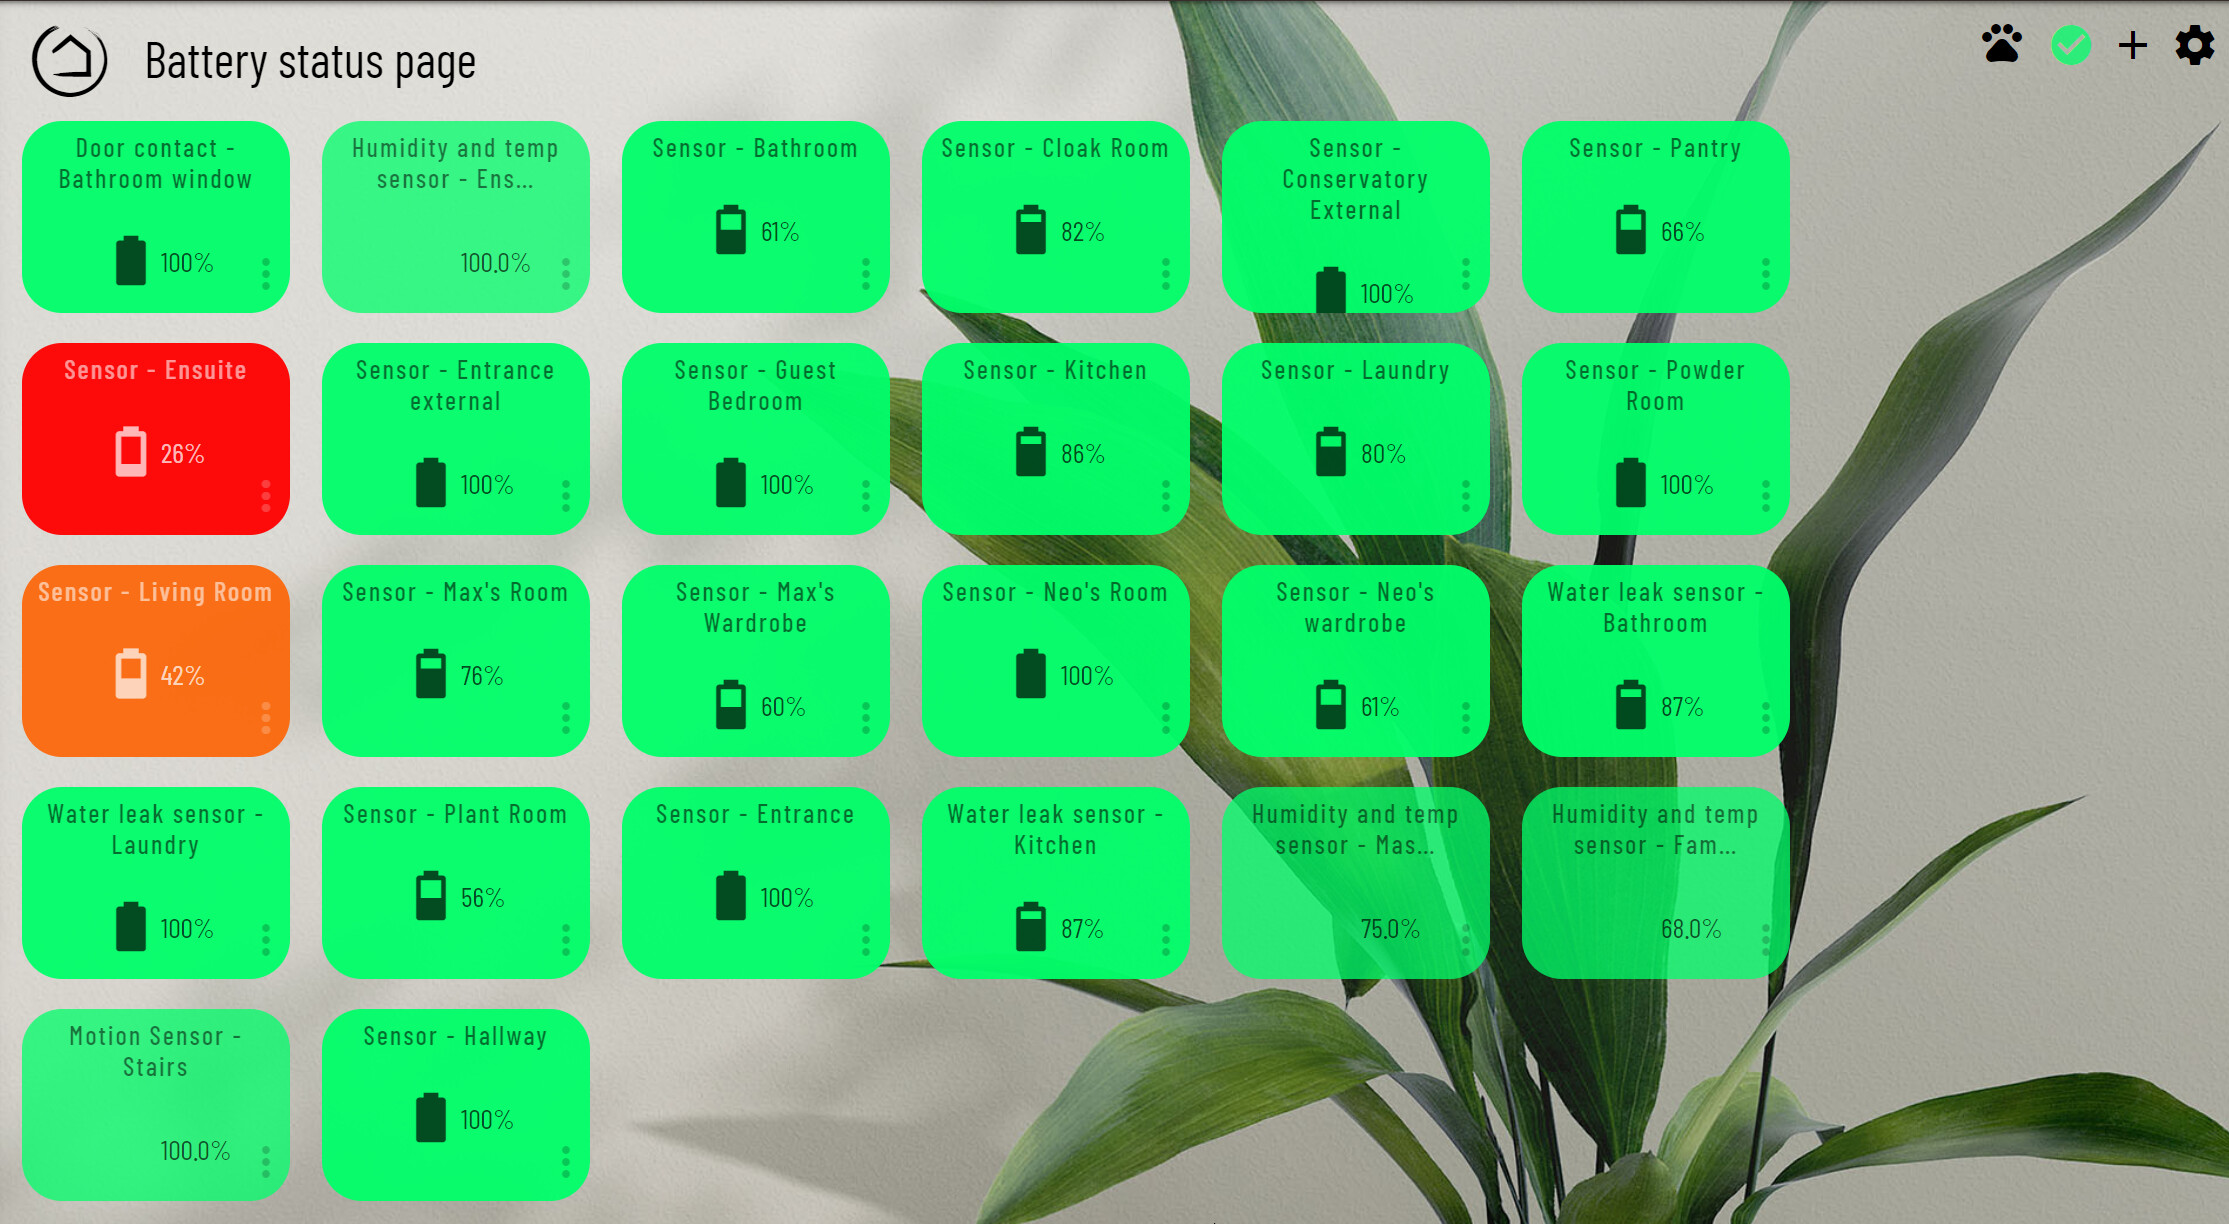
I’ve just gone ahead and added some Sonoff devices (all using Markus’ drivers) to my Battery status dashboard and found that none of the Sonoff tiles come up with a battery icon. I added a Hue sensor to the dashboard at the same time, and that one got its battery icon. Weird?
Edit: I tried re-compiling the dashboard through the Smartly site, but got the same result.
That’s an interesting issue. Tagging @spelcheck to get his input on that one. Can’t say it’s overly surprising HE only misses device uses Marcus’s drivers.  Disappointing to say the least.
The only advice I can offer is a workaround. You can set the icon via CSS. The more I think on it, that would be a mess since the battery icon changes with the % level. Let’s give the master a bit to opine on the subject.
I think the issue is the decimal point. I see the same thing. Integer values get an icon, and reports that include a decimal point do not.
Good call!
In that case @Mattias use one of the many averaging apps to give you a virtual device mimicking those devices with no decimal. Unless of course you can simply change the output in the driver.
I vote for this! I don’t know anything about groovy code, so I hesitate to try. It does seem odd that we get decimal precision for battery life- no way are the battery measurements made by these cheap devices anywhere close to accurate enough to require decimal representation. Anyone with skill- can you post a code patch?
I agree with you, but from a cursory overview of the drivers that I think you are using, could you post the ones just so I am sure, battery is being generated from a voltage reading and then scaling that to the 0-100% scale, which is generating decimal place. But from the code I am seeing, it seems to round as the last step, but my guess is the type is still decimal. I wonder if it would be as simple as casting the rounded output as an int.
Unfortunately, I do not use any of those drivers so I cannot test it out.
In my case, I see decimal battery percentages reported from my Aqara devices… I’m using Markus’ drivers located here: [Release] Xiaomi / Aqara / Opple Drivers with Presence!