I would do if I knew how to create a node Palette in NR… any usefull link ?
… I’m sure that i could find some stuff already done googling the net ,
That Is quite simple. May be not so efficient, as i have to get/set all the values in a global variable. I’ll try anyway
Nothing to worry about really, I have insanely complex subflows which run fast enough that I can’t notice the delay. Switching in and out of subflows do add 8-14ms, so chaining subflows may be less than ideal if many of them. So in terms of speed issues in NR it is usually more about context switching related delays. Such as the link-in and link-out nodes.

This Is a meno for me ![]()
1 Like
btw, in the graph node which is the format of the array to be provided?
[[last_seen,value],[last_seen,value],…]
or
[[last_seen, last_seen,…][value,alue,…]]
As I need to preserve the values for different subflows instances, which is the correct context level to save values? flow or node?
This is a sample inject node which should work:
[{"id":"e232cd5816952f5b","type":"inject","z":"412e609f9ea1c519","name":"Inject table","props":[{"p":"data","v":"[{\"col1\" : 11, \"col2\" : 21},{\"col1\" : 12, \"col2\" : 22}]","vt":"json"},{"p":"columns","v":"[\"col1\", \"col2\"]","vt":"json"},{"p":"labels","v":"[\"Col1\", \"Col2\"]","vt":"json"}],"repeat":"","crontab":"","once":false,"onceDelay":0.1,"topic":"","x":760,"y":180,"wires":[[]]}]
EDIT:
The flow context is scoped to the subflow, per instance, the node is scoped per node, just like it is elsewhere in NR. It IS possible to access the flow context of the flow tab the subflow instance is inside using the $parent route.
I’m near to the solution. I’m testing a simple one-variable FIFO data subflow that feed a graph node. It is not clear to me the time format. I have last_seen format that is unix timestampx1000. How does graph node manage the time formatting?
1 Like
It needs the timestamp in epoch seconds, so if you have it ms, just divide by 1000 and run Math.round on it.
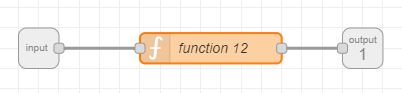
here the short code
a=flow.get("array","ram") || []
max=env.get("max");
field=env.get("valuefield");

n=a.length
if (n==max){
    a.shift()
}
a.push([Math.round(msg.payload.last_seen/1000),msg.payload[field]])
flow.set('array',a,"ram")
msg={"data":a}
return msg;
and here the export
[{"id":"93de491cf049e172","type":"subflow","name":"TIME STACK","info":"","category":"","in":[{"x":60,"y":100,"wires":[{"id":"5fd4b3a9dc2e7a02"}]}],"out":[{"x":380,"y":100,"wires":[{"id":"5fd4b3a9dc2e7a02","port":0}]}],"env":[{"name":"max","type":"num","value":""},{"name":"valuefield","type":"str","value":""}],"meta":{},"color":"#DDAA99"},{"id":"5fd4b3a9dc2e7a02","type":"function","z":"93de491cf049e172","name":"function 12","func":"a=flow.get(\"array\",\"ram\") || []\nmax=env.get(\"max\");\nfield=env.get(\"valuefield\");\n//max=50\n//field=\"temperature\"\n\nn=a.length\nif (n==max){\n a.shift()\n}\na.push([Math.round(msg.payload.last_seen/1000),msg.payload[field]])\nflow.set('array',a,\"ram\")\nmsg={\"data\":a}\nreturn msg;","outputs":1,"noerr":0,"initialize":"","finalize":"","libs":[],"x":230,"y":100,"wires":[[]]}]
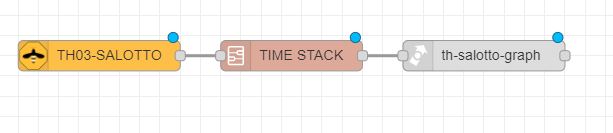
The subflow has two “parameters” to be set by the users: max number of values, payload value field (the variable to be plot) .
The usage is very simple: put in a chain sensor->subflow->dash-graph-node.
That is all
Future improvements : multi series support, stats (mean, devs,…)
2 Likes
@markus It seems than time plot node loose the dimension changes when I close my browser . Is it possible? I alway get old values and the widget returns to the previous size/position
It shouldn’t be, but there could still be serious bugs in these plot nodes. Could you provide screenshots of what happens, please?
Simply I try to change dimensions to the widget. It works until I exit the browser.
When I come back , I have to deploy again the flows and I find the old dimensions.
as you can see in the following image (compare with the one I posted previously).
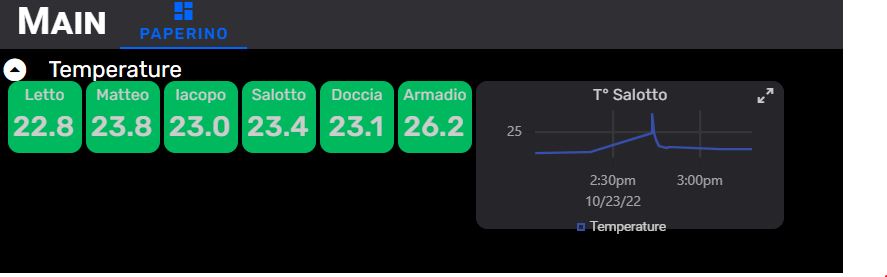
The widget loose also some other changed attibutes (e.g. line color)
The dimensions you can fix by setting rows and columns to make it larger by default. As for the lost color attribute as well as other attributes, that would be a bug. Marking this for when I get back to working on the dashboard code again. In the meantime some potential work-arounds could be: setting NR to resend the settings when a browser connects, or setting the colors using the property panel instead of in messages (might work).
That Is my problem. I changed rows and cols values (old 4,4, new values 6, 5) but when I exit and come back I have to deploy again the flows and I find again 4, 4.
Not in a hurry
that’s fairly strange, I definitely need to sort that out… Does that happen with any other types of tiles for you?
No. it seems the problem affects only graph node:
- change a sensor node dimension → I can exit the browser and reentering without any problem.
- change a graph node → if I close the browser and the I reenter NR, the deploy button become red and I have to redeploy. After deploy the graph node returns to its previous dimension.
EDIT: One of my sensor node reverted to a previous state. The problem occours only If I do deploy my flows when I reenter in NR
EDIT: iframe node: it would be nice if the image would automatically be scaled down to fit height or width iframe dimensions
1 Like
Ok, thank you, I’ll look at this next time I work on the dashboard
… should you rework the graph node, may I suggest you to rearrange the format of the multi series graphs data?
I propose the following:
{<serie1-name>:[[<timestamp>,<value>, …], <serie2-name>:[[<timestamp>,<value>, …], …}
2 Likes