We had a question in beta about how to monitor internet connection. Great question! This can be done on other platforms. You can run Uptime Kuma wherever. We just happen to provide it on CORE because it’s a great tool with a ton of benefits. That being said, below is a walkthrough on setting it up on CORE. If you’re doing this on another system, you’d need to modify it accordingly.
After enabling Uptime Kuma on CORE
sudo oll-uptime-kuma --enable
sudo oll-uptime-kuma --start
You can also do this in SYS|Dash
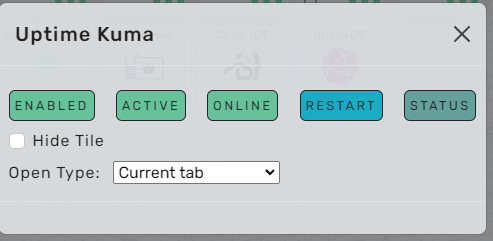
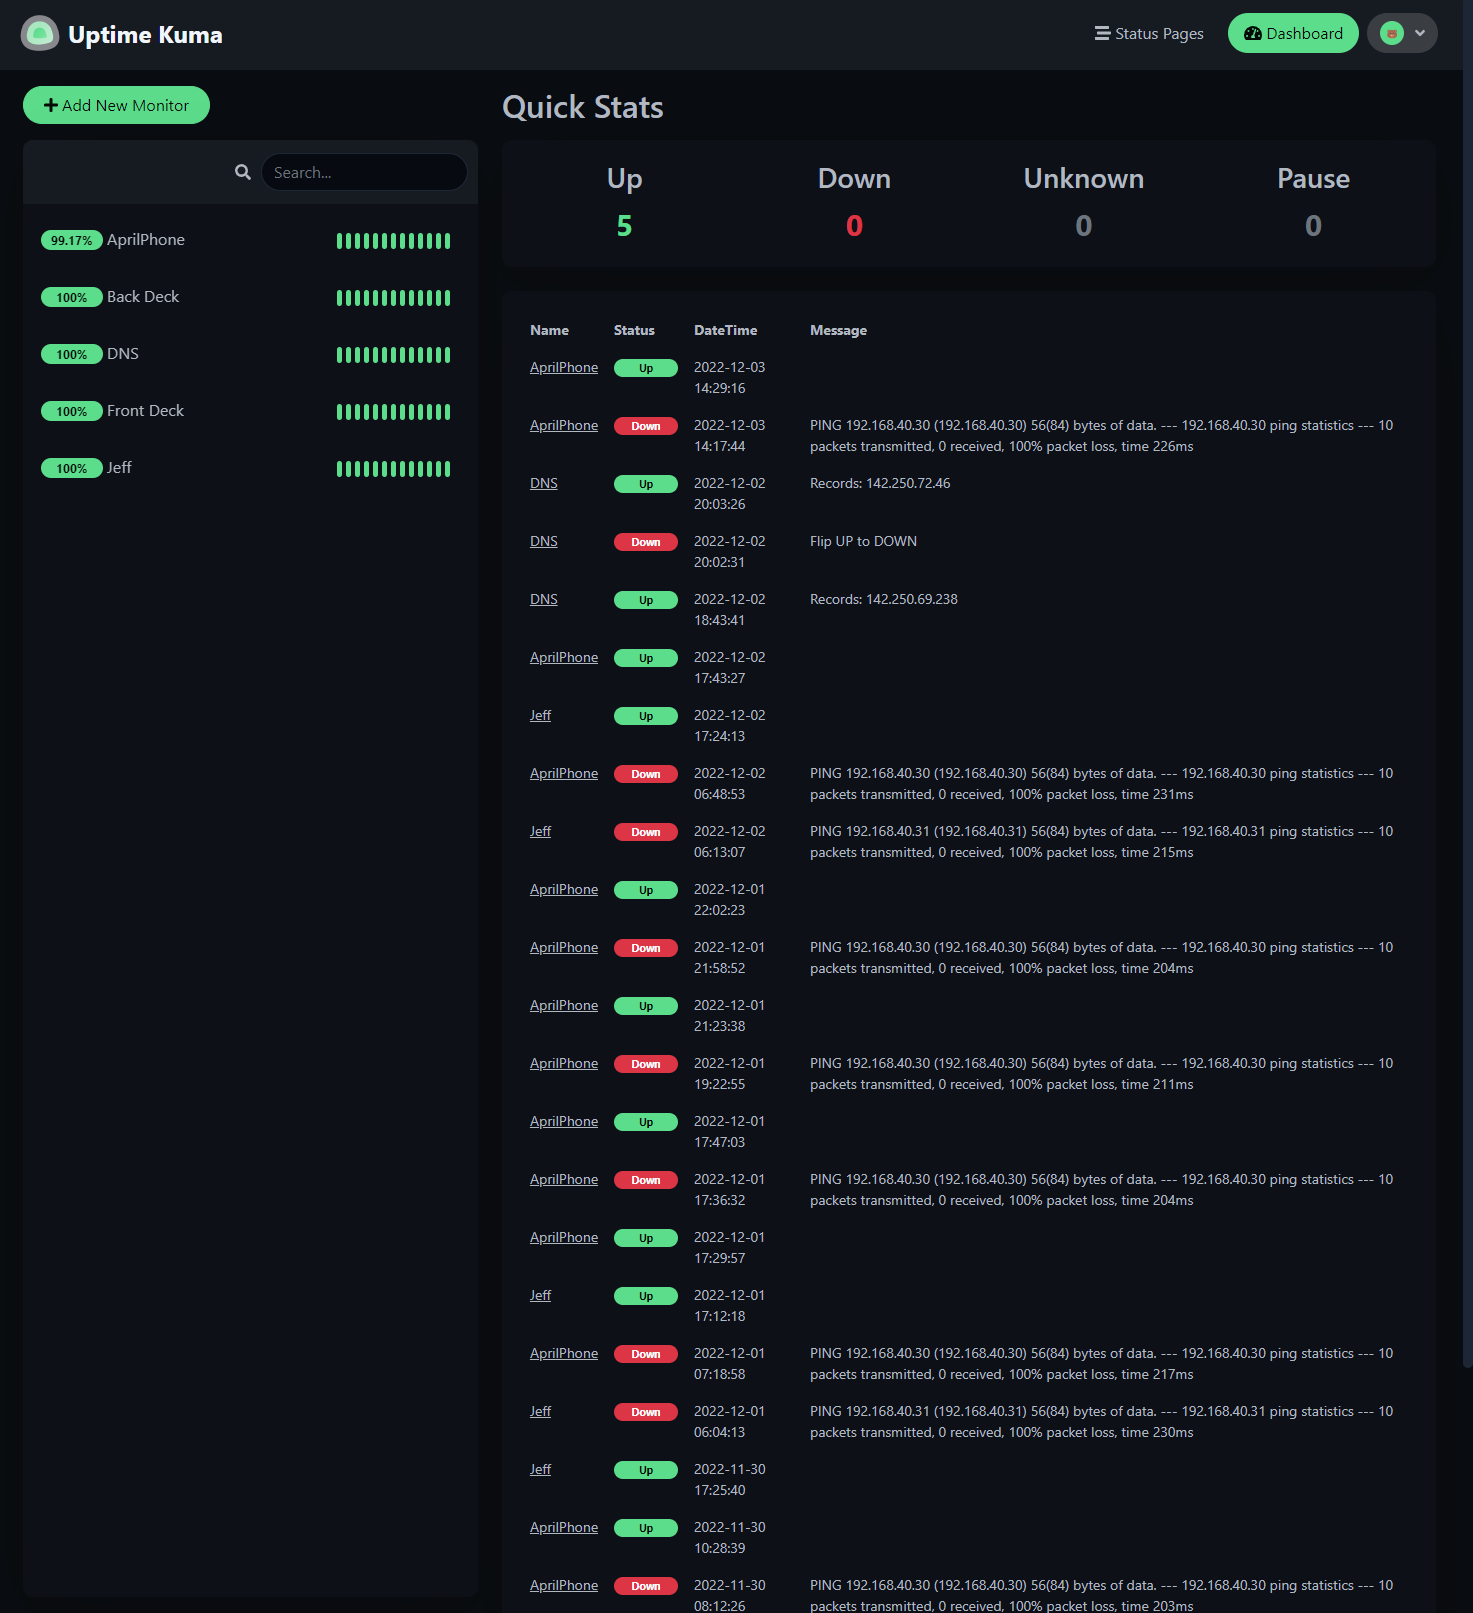
Once it’s up and running, open the interface. The tile will be in SYS|Dash.
First
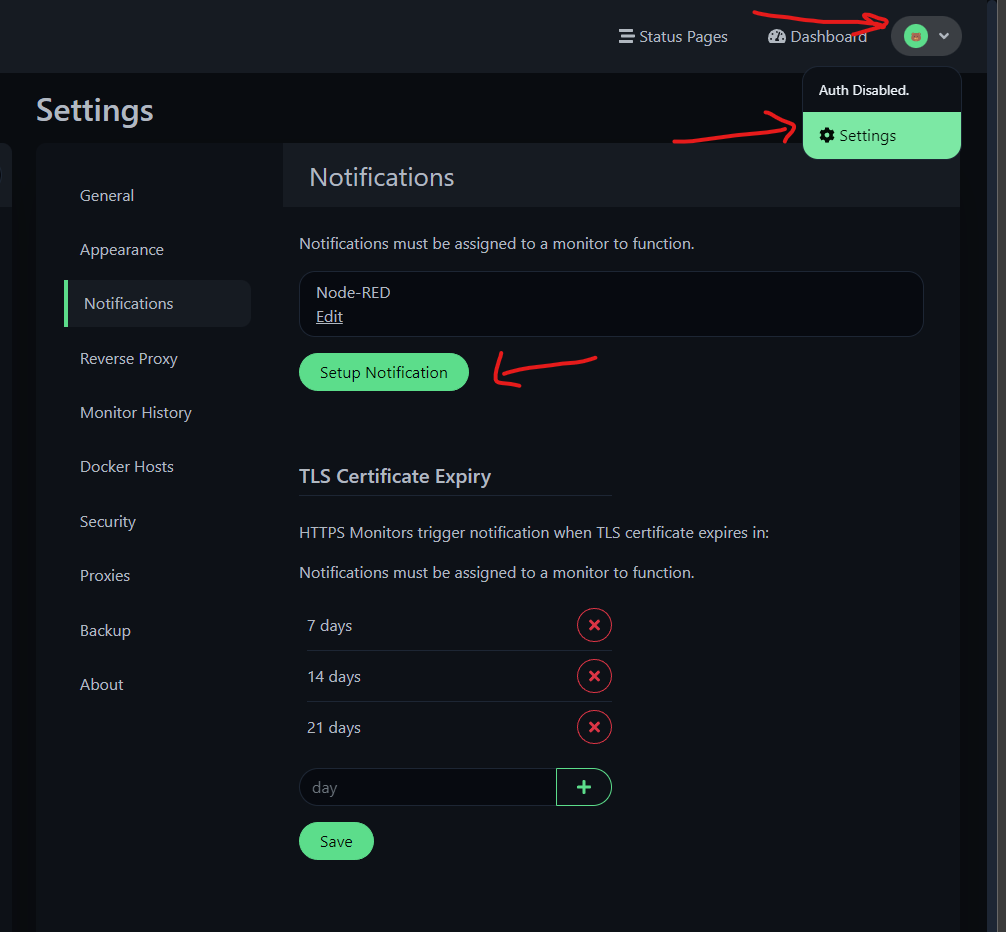
Go into settings and create the notification.
in the upper right hand corner click the down arrow.
Click Settings
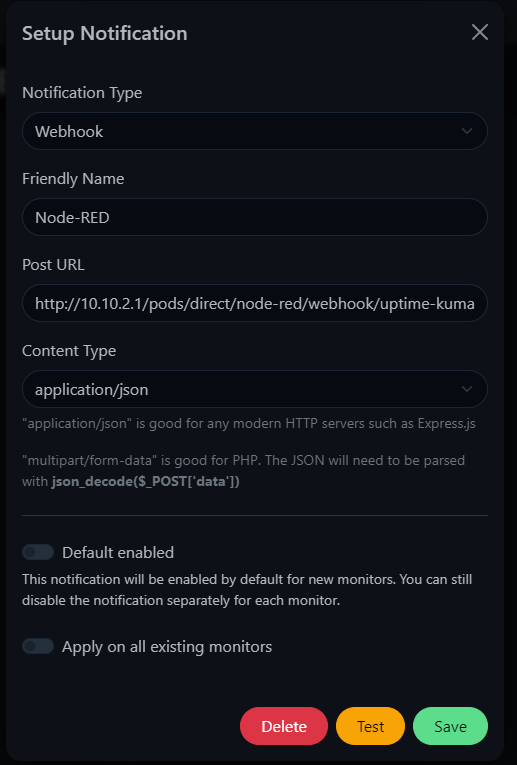
Setup Notification
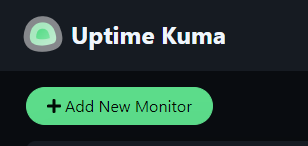
Click Add new monitor
There are a ton of things you can do with Kuma. Check out the list!
We’re choosing DNS for this example
Here are some example settings. Don’t set your interval on this one for less than 60 seconds, or it may stop resolving for you.

Turn on the Node-RED Edit switch
Click Save on the webhook
and Save on the monitor page.
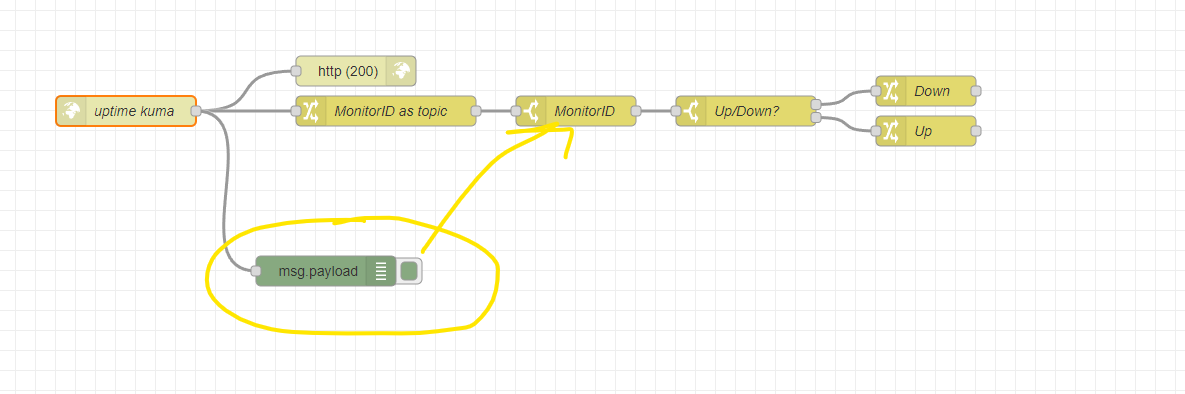
Next, you need to go to Node-RED
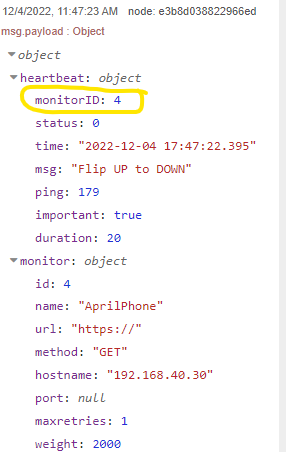
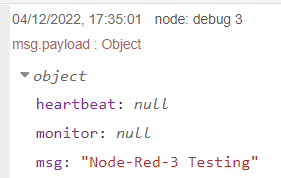
If you turn on the upside down mode, you can get the information you need to straighten out the flow for yourself. (This is for testing) Don’t forget to turn it off in this case. Upside down has other use cases, but here, use it to harvest your Node-Red Information.
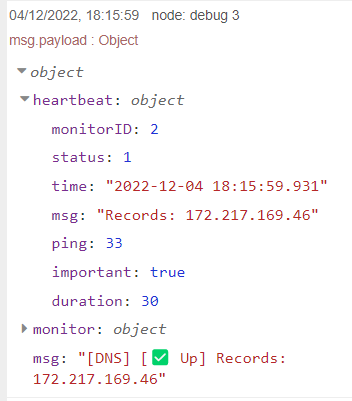
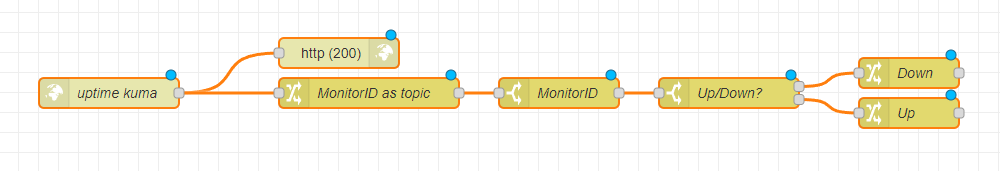
Add a debug node right out of the uptime kuma node to get the output.
Don’t forget that you will always need the http (200) reply for this to work. For webhooks, the 200 node must be paired with http in.
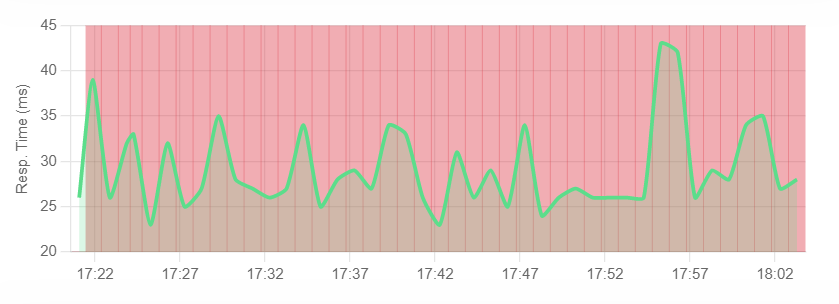
After you complete the flow and customize it, you can monitor your Internet!
[{"id":"6fabca6b70567331","type":"http in","z":"b12af926a1d7a0d3","name":"uptime kuma","url":"/webhook/uptime-kuma","method":"post","upload":false,"swaggerDoc":"","x":1410,"y":2280,"wires":[["d8ff5fe2508a6859","9a1280ccf12f08b4"]]},{"id":"d8ff5fe2508a6859","type":"http response","z":"b12af926a1d7a0d3","name":"","statusCode":"200","headers":{},"x":1640,"y":2240,"wires":[]},{"id":"9a1280ccf12f08b4","type":"change","z":"b12af926a1d7a0d3","name":"MonitorID as topic","rules":[{"t":"set","p":"topic","pt":"msg","to":"payload.heartbeat.monitorID","tot":"msg"}],"action":"","property":"","from":"","to":"","reg":false,"x":1670,"y":2280,"wires":[["b461396ecc9f0995"]]},{"id":"b461396ecc9f0995","type":"switch","z":"b12af926a1d7a0d3","name":"MonitorID","property":"topic","propertyType":"msg","rules":[{"t":"eq","v":"6","vt":"num"}],"checkall":"true","repair":false,"outputs":1,"x":1860,"y":2280,"wires":[["7efa8d72e0ac75c3"]]},{"id":"7efa8d72e0ac75c3","type":"switch","z":"b12af926a1d7a0d3","name":"Up/Down?","property":"payload.heartbeat.status","propertyType":"msg","rules":[{"t":"eq","v":"0","vt":"num"},{"t":"eq","v":"1","vt":"num"}],"checkall":"true","repair":false,"outputs":2,"x":2030,"y":2280,"wires":[["c151a12a21f3c77b"],["16331fdb5f779c75"]]},{"id":"c151a12a21f3c77b","type":"change","z":"b12af926a1d7a0d3","name":"Down","rules":[{"t":"set","p":"payload","pt":"msg","to":"false","tot":"bool"}],"action":"","property":"","from":"","to":"","reg":false,"x":2210,"y":2260,"wires":[[]]},{"id":"16331fdb5f779c75","type":"change","z":"b12af926a1d7a0d3","name":"Up","rules":[{"t":"set","p":"payload","pt":"msg","to":"true","tot":"bool"}],"action":"","property":"","from":"","to":"","reg":false,"x":2210,"y":2300,"wires":[[]]}]
[EDIT]
Wanted to mention that you only need to set up this flow one time in Node-RED. If you want notifications on other devices/services set up in Uptime Kuma, you can just add it to the flow. Set it up as a separate tab in Node-RED. You can then link out to, perhaps, a pushover page that will notify you when you have … incidents.
If you go back to your setup notification screen, you have an option to set this as default and apply to all existing monitors.