HI TechMeax.
I did not expect a super quick response from developers, I thought maybe someone could just point me in the right direction.
It’s been over a year since I used smartly and decided to revamp my dashboards (that a testimony to how good the product is)
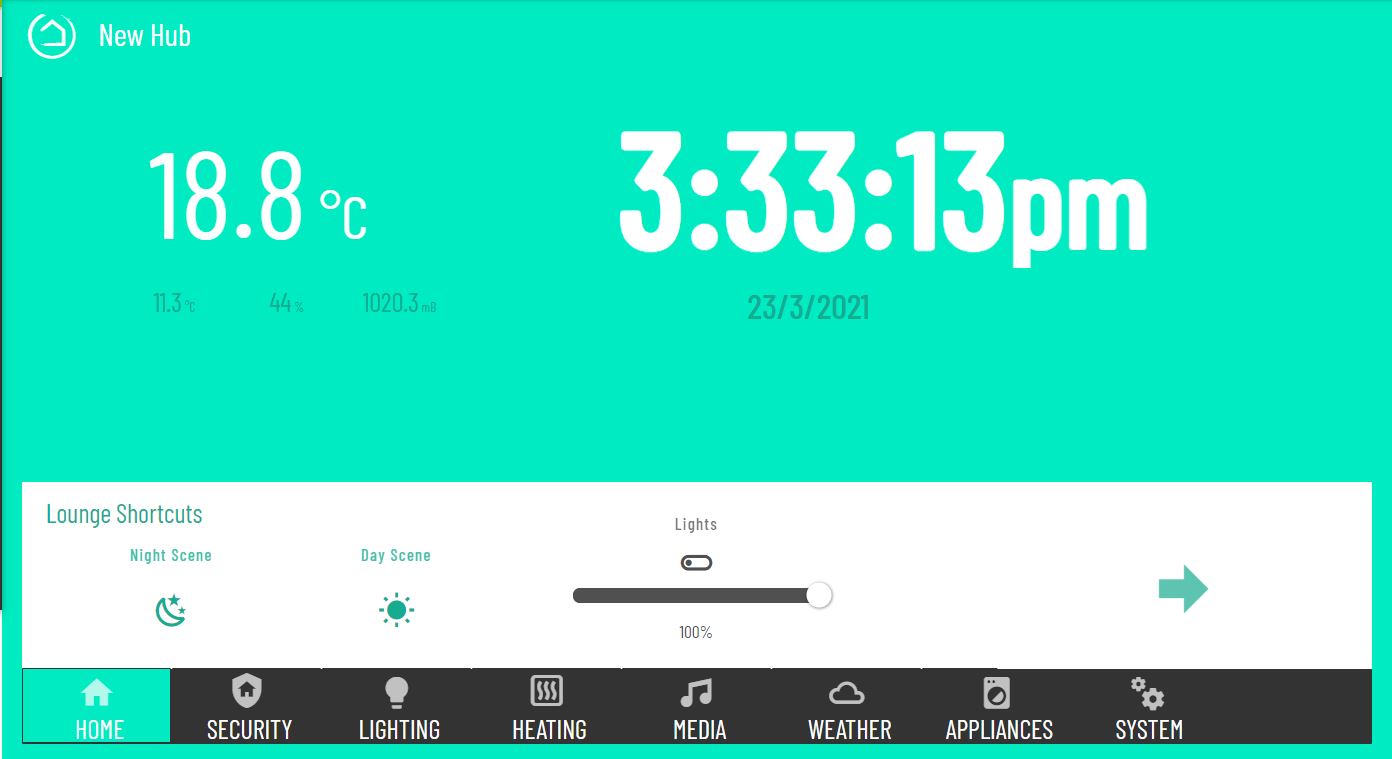
This is a sketch of the early mockup I have created.
As you can see I have a date/time attribute under the clock which is cropped. Ideally I would like a date attribute that could have the colour changes and what parts can be displayed. I.e day, month
The default has this wacky way of displaying it which is not ideal.
Anyway also would love to hear more input.
Edit: I don’t suppose there is anyway to get rid of the second hand from the clock is there. I have a feeling I know the answer but thought I would check
So that’s the Date-Clock attribute (not “Date”) which does have a few mods. Unfortunately I don’t think much more can be done with it. However, while appreciate the consideration, I’m not a dev, and I’ll have to tag @spelcheck for confirmation. That tile seems to be pulling system time, and there doesn’t seem to be any separation of anything, meaning we cannot manipulate anything.
Just spit balling here, but we might have better luck using a “custom app” to pull the data from a time server and configure it to have a better output attribute. Not being a dev I don’t know how to do that, or if it is possible.
I’m using the date/time and time tile in this design. However would like to see the date tile customisable as you suggested whilst using the time tile additionally.
You have had your fair share of input into this for a while, okay you may not be coding, but you are one of the core developers - I’m sure @spelcheck thinks that too
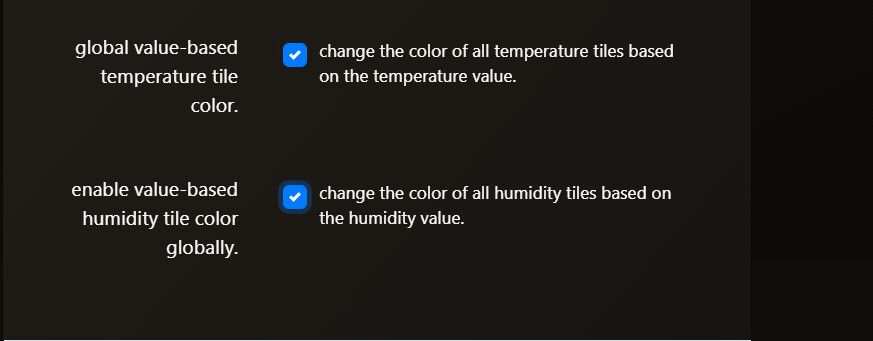
Thanks for reporting this @BorrisTheCat. I just tested and I see what you mean. The check boxes on the smartly editor are un-checked when going back. However the setting does seem to stick, meaning the color changes are still applied, even if you do NOT recheck the boxes.
Can you please confirm this is what you are seeing as well, and I’ll get a bug report going.
I wanted to circle back with you on this. While admittedly I’ve been spending too much time Egg Hunting I did spend some time messing with this. The one thing I’m hung up on is how to get all the div’s combined. I might need some expert help from @spelcheck on this one. His mojo is much more powerful than mine.
Here are the class you can traget and some of the ‘hacking’ I’ve done thus far.
A search did not find an answer to this.
I need to move the smartly-inject tile on my dashboard, but am not sure how to select the tile as it is always hidden.
It is overtop of a menu tile and the smartly-inject tile is not hidden on my older iPad.
I should have used this in my example.
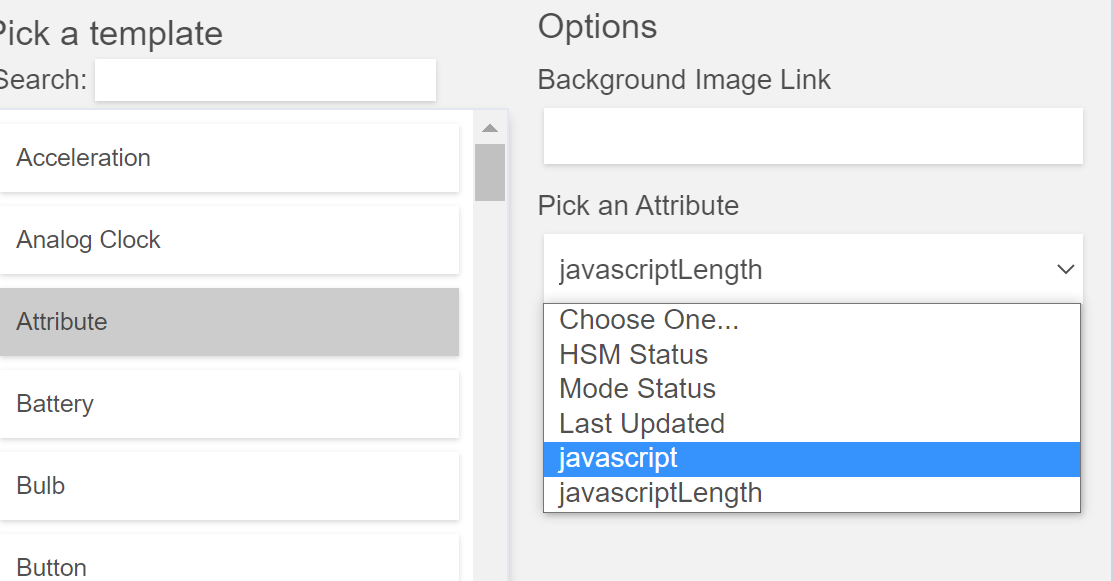
“templateExtra”: “javascript”
And I am assuming since you told me to search for “javascript” then it is the smartly injector tile.
I will remove the (2) extra’s.
Should there be a error message when someone attempts to insert more than one smartly injector tile?
Technically it’s not an error, just not needed. It won’t create “problems”, but it’s unnecessary. Not sure we need extra dev just to tell people not to. It’s your hub/dashboard put as many as you like
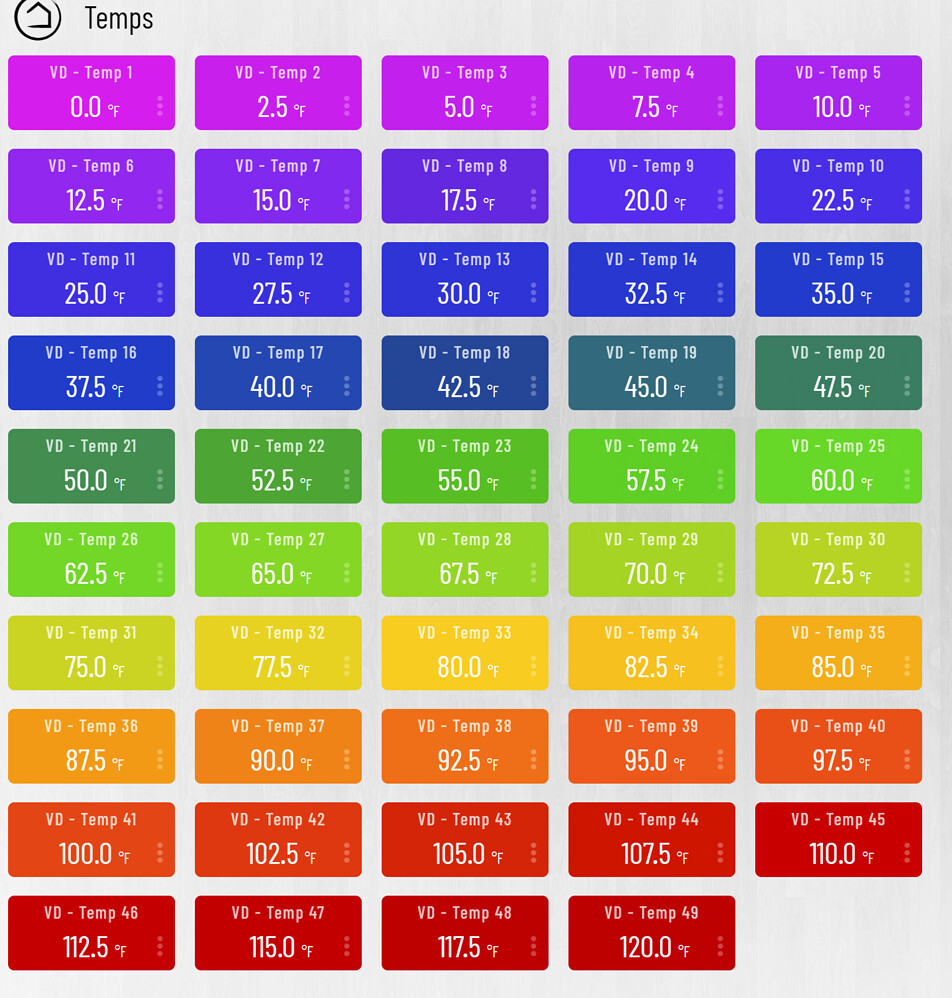
Trying hard here to use the temp/humidity gradient feature but not being able:
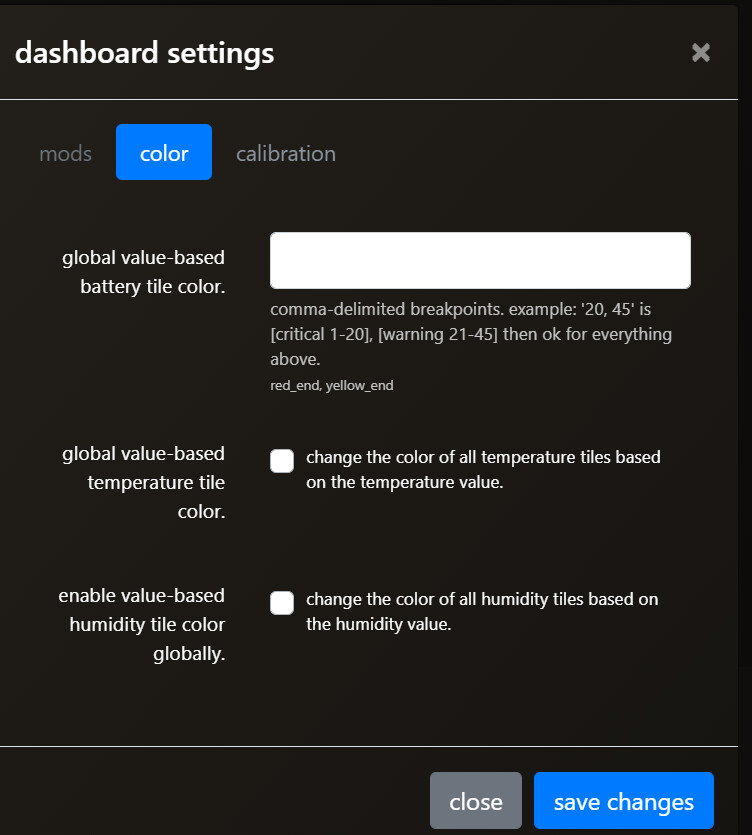
if I mark the checkbox of “global value-based temperature tile color.” or the humidity, when I click save those options are un-checked
if I try to use directly on the tile, where I put in there “0,5,10,15,20,25,30,35” since I am in a tropical country and with Celcius scale I get the options saved but on the tiles I only see purple regardeless the temperature.
Yes, any “dynamic” changes are done by the smartly injector. Once added, you’ll see the tiles are purple when the dash is 1st loaded then the color fills in once smartly inject works it’s magic. Without it they will not function.
EDIT oh wait you mean humidity? Not sure if I have a chart for that, let me check.]
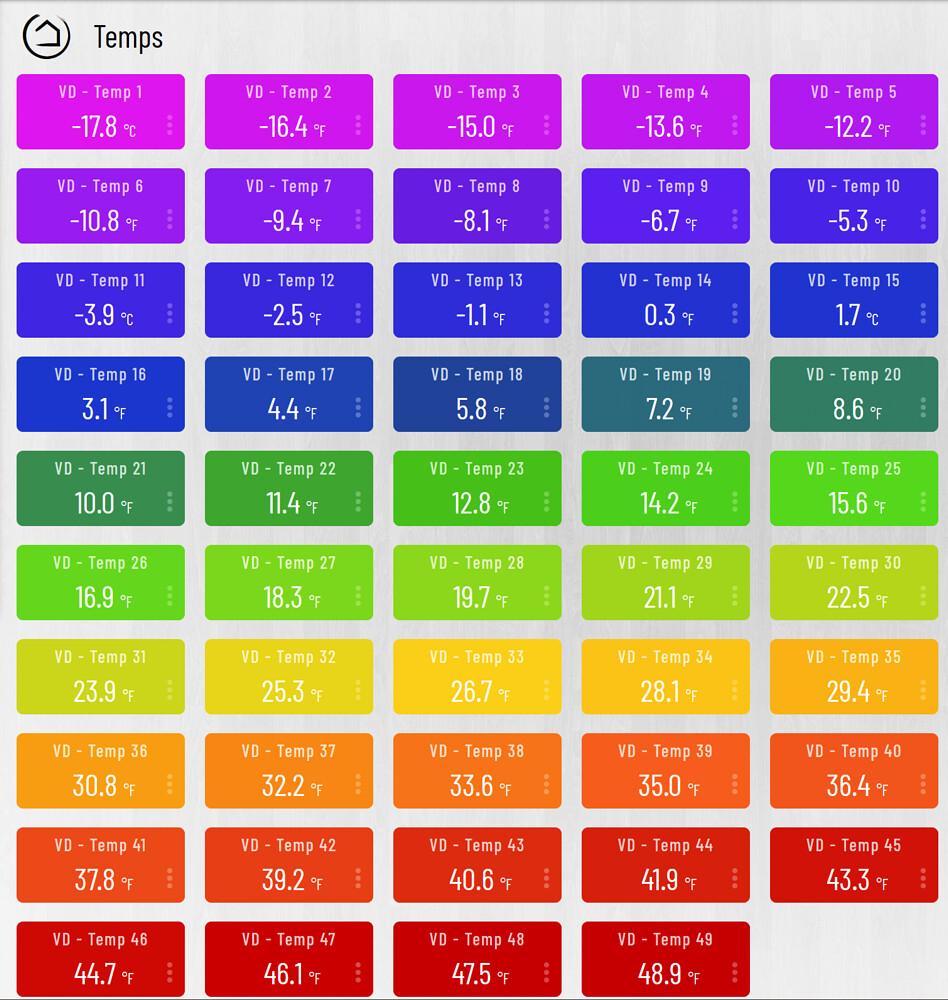
No sorry doesn’t look like I made a humidity color chart. I should. If you want you can add a dozen or so virtual sensors and set them all to 10 percent increments (or less) then put them all on a dash with smartly injector and post the results.
So, I have had the tile for smartly on a few dashboards on everything working correct. I went through just now and created new dashboards manually for the rooms in my house and added the tile for smartly, also manually. None of these new dashboards are showing the paw print. The previous instances of smartly are functioning as expected. Nothing happening in the logs besides this,
“Now: 1621840085425, JS length: 1015, Maximum is 1024,”
If the tile remains on the screen with 1015 showing, the wrong option is set. Change it to ‘javascript’ If that’s not it LMK and we’ll dig deeper (I did just create a fresh dash to test. It seems to be working as expected)
ok…
Is it possible that Smartly and ‘other dashboard editor’ ‘screw’ each other up? (sorry for the word ‘screw’, I can’t seem to find a better word (my english is not thet good)).
I Like “DashEd” it’s great for layouts of the house and fit a switch between lines of a ‘svg’ background.
But the freedom of moving things every pixel is a nightmare for a dashboard with only buttons.
I Like “smartly” it’s great for more button-based dashboard and with custom ‘looks’.
And i would like both…
‘main dashboard’ with all lights, outlets, etc where you can control the house. nothing fancy just functional.
‘fancy dashboard’ of every floor with outlets, lights, sensors etc on a floorplan and on there positions like real life. (easier for the kids)
Guess there is no way to have both?
On second thought…
I could just throw those away but what with there bodies…?